Start here
As public sector workers who do stuff with data we frequently find our bosses saying “Hey, could you make a plot of these data”. We say, “Sure!” and then we typically:
- Open the data in Excel
- Cut out irrelevant bits and move stuff around so that it makes sense
- Plot it
This works pretty well and we’ve all gotten pretty good at it. But there are some problems beneath the surface that make our lives less fun and makes our work less useful. Having been in the public service for two years now, the biggest problem I’m feeling with this approach is that all the work done in steps 2. and 3. only makes this one plot. This problem typically comes to the surface when our bosses say at a later date “Hey, you know that plot you made back then, could you update it?”. We say “Sure!” and then we typically:
- Open the new data in Excel
- Cut out irrelevant bits and move stuff around so that it makes sense
- Plot it
So, to make another plot requires doing all the same bits of pointing, clicking, writing formulas over again. This problem only gets bigger if the person who produced the first plot has left and you are asked to update someone a colleague’s plot. It can be hard to tell which bits they cut out and how they rearranged the data in the spreadsheet.
This is one of the reasons why using a programming language such as R is more useful than a spreadsheet such as Excel. In R, the commands to cut up, arrange and plot data can be:
- Written once and then applied to future data sets so work on making the second and subsequent plots is massively reduced
- Stored and read by by other people (including future versions of ourselves) so make sense of what we’ve done and apply it to new situations
Move onto here
So, how would this be done in R? There are lots of ways to achieve this but here is one…
Lets say that you are asked to plot the number of children resident in South Australia in 2017. You are given a data set called sa_pop with the population for each year of age in each year going back to 1971. The first few lines of the data set look like this:1.
| Year | Age | Population |
|---|---|---|
| 1971 | 0 | 22184 |
| 1971 | 1 | 22100 |
| 1971 | 2 | 22293 |
| 1971 | 3 | 21854 |
| 1971 | 4 | 21313 |
| 1971 | 5 | 21950 |
The code to produce the plot and its result look like this:
sa_pop %>%
  filter(Year == "2017") %>%
  ggplot(aes(x = Age, y = Population)) +
  geom_col() +
  labs(title = "Population of children resident in South Australia in 2017")
That’s it!
And, as you can probably guess, that means you only have to change one thing to update it for 2018!
sa_pop %>%
  filter(Year == "2018") %>%
  ggplot(aes(x = Age, y = Population)) +
  geom_col() +
  labs(title = "Population of children resident in South Australia in 2018")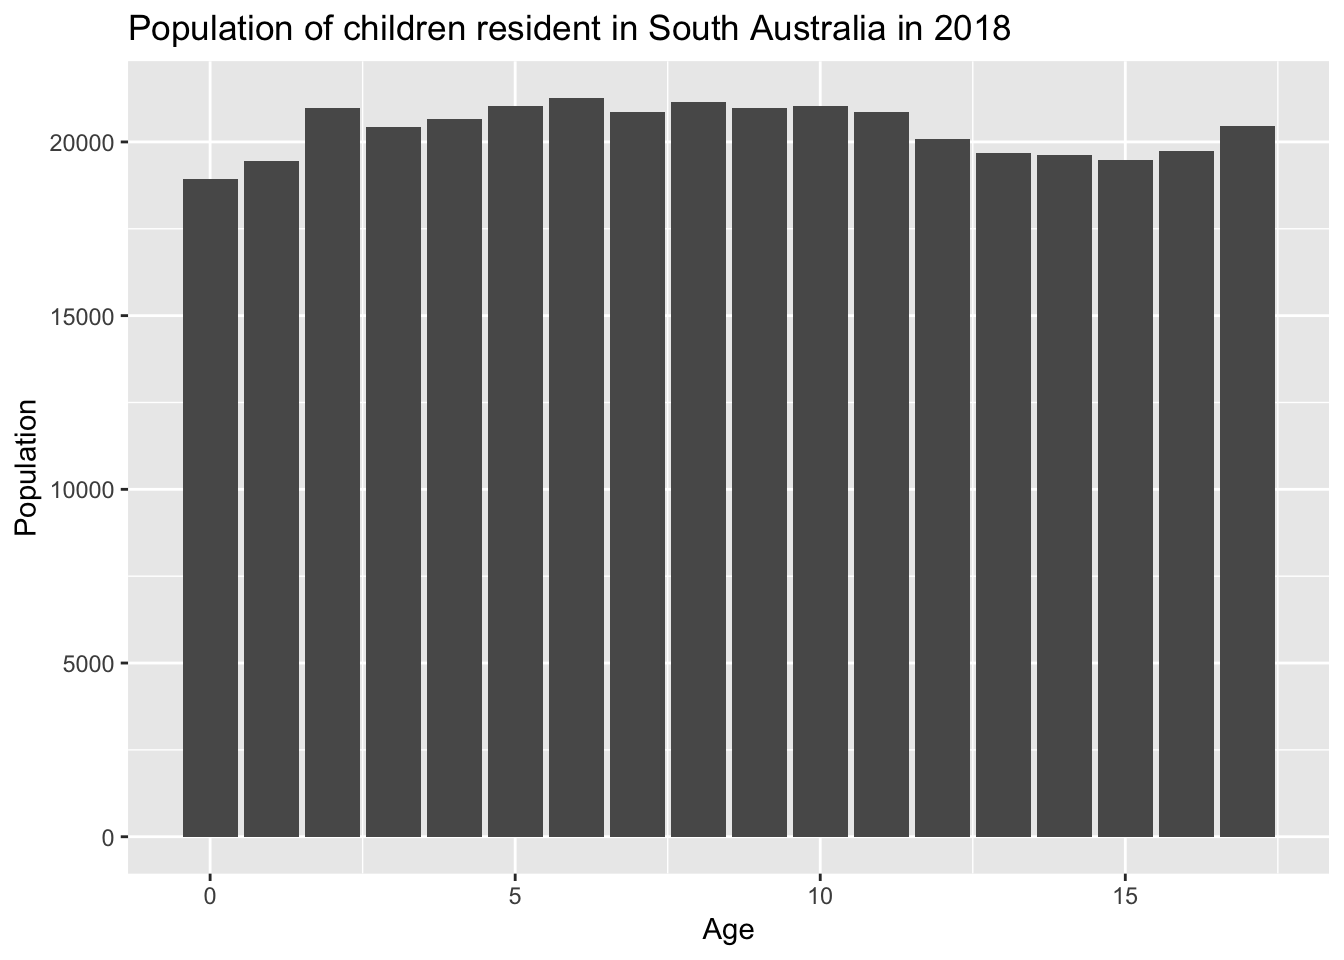
Finish here
At this stage I might dwell on one other thing I really like about using R to do this sort of work rather than Excel. I like that the effort I’ve gone through to make the plot is visible to my boss.
Often when I used to use Excel to make a plot, the only thing I had to show for my labour was the finished product. And that only came after a lot of work. Meanwhile, my colleagues who wrote policy could circulate drafts of their writing, which showed that they were producing work in an orderly process.
By writing code instead of clicking around in a spreadsheet I, and my boss, can see that there is something I have done, even if its not finished yet.